Debugging Bryntum components
The browser debugger.
Open the browser's debugging console. Uncaught fatal errors will be logged there. The full stack trace of all the function calls which led up to the failure will be listed there and are always useful for debugging purposes. Always include this call stack in any bug report.
Accessing components in a running application.
Querying by component type
The bryntum.query function is always available to query widgets in a Bryntum application
by widget type. For example, to access the first Scheduler on your page use:
theScheduler = bryntum.query('scheduler', true)
This will return a reference to the first Scheduler instance and you can use the full API from the debugger command line.
Passing the second parameter as true matches any subclass of the type specified.
There is also a bryntum.queryAll function which returns an array of all matching components.
Getting the encapsulating component from an element
If examining the DOM structure, you can use the bryntum.fromElement function
to access the closest matching widget which encapsulates the passed element, eg, when you have a node selected in the "Elements" tab,
the token $0 will reference it in the debugger command line:
theCombo = bryntum.fromElement($0)
Components have a tree structure analogous to the DOM tree. You can find any ancestor of a component by type:
theEditor = theCombo.up('popup', true)
The second parameter means it will match any subclass of Popup, so this could find an encapsulating EventEditor or TaskEditor.
When you have access to the component, you can use its documented API to inspect it to access its internals and examine them in any way:
multiAssigned = theScheduler.eventStore.getRange().filter(e => e.resources.length > 1);
Getting a component by id
If you know the id of a component, you can use bryntum.get:
theCalendar = bryntum.get('app-calendar')
Debugging code.
You can use the "Sources" tab of the browser debugging console to set breakpoints in your code to have it halt at certain lines to allow you to examine application state.
Using the right click gesture, these breakpoints can be made conditional to only break when a certain expression evaluates to a truthy value.
If a certain error only occurs after some other line of code has been executed, you can have that line set a flag which a future breakpoint can then evaluate.
So at the line which needs to execute before the error happens, set a conditional breakpoint using a condition like this:
(window.doBreak = 1),0
That sets the doBreak global to 1, but does not break at that line because the value of that expression is zero.
A future breakpoint conditional on the expression window.doBreak will then only halt execution when that first breakpoint has
been passed.
Discovering fired events
A special event name, catchAll may be used by event listeners which will call the listener for all events.
You can use this to discover useful events emitted from your UI by adding such a listener from the debugger console:
myCalendar.on('catchAll', (e) => {
    if (e.type.endsWith('click')) console.dir(e);
});
Focus issues
The Chrome debugging console's "Elements" tab allows you to set an "Emulate a focused page" flag which means that even while debugging, focus remains in your application.
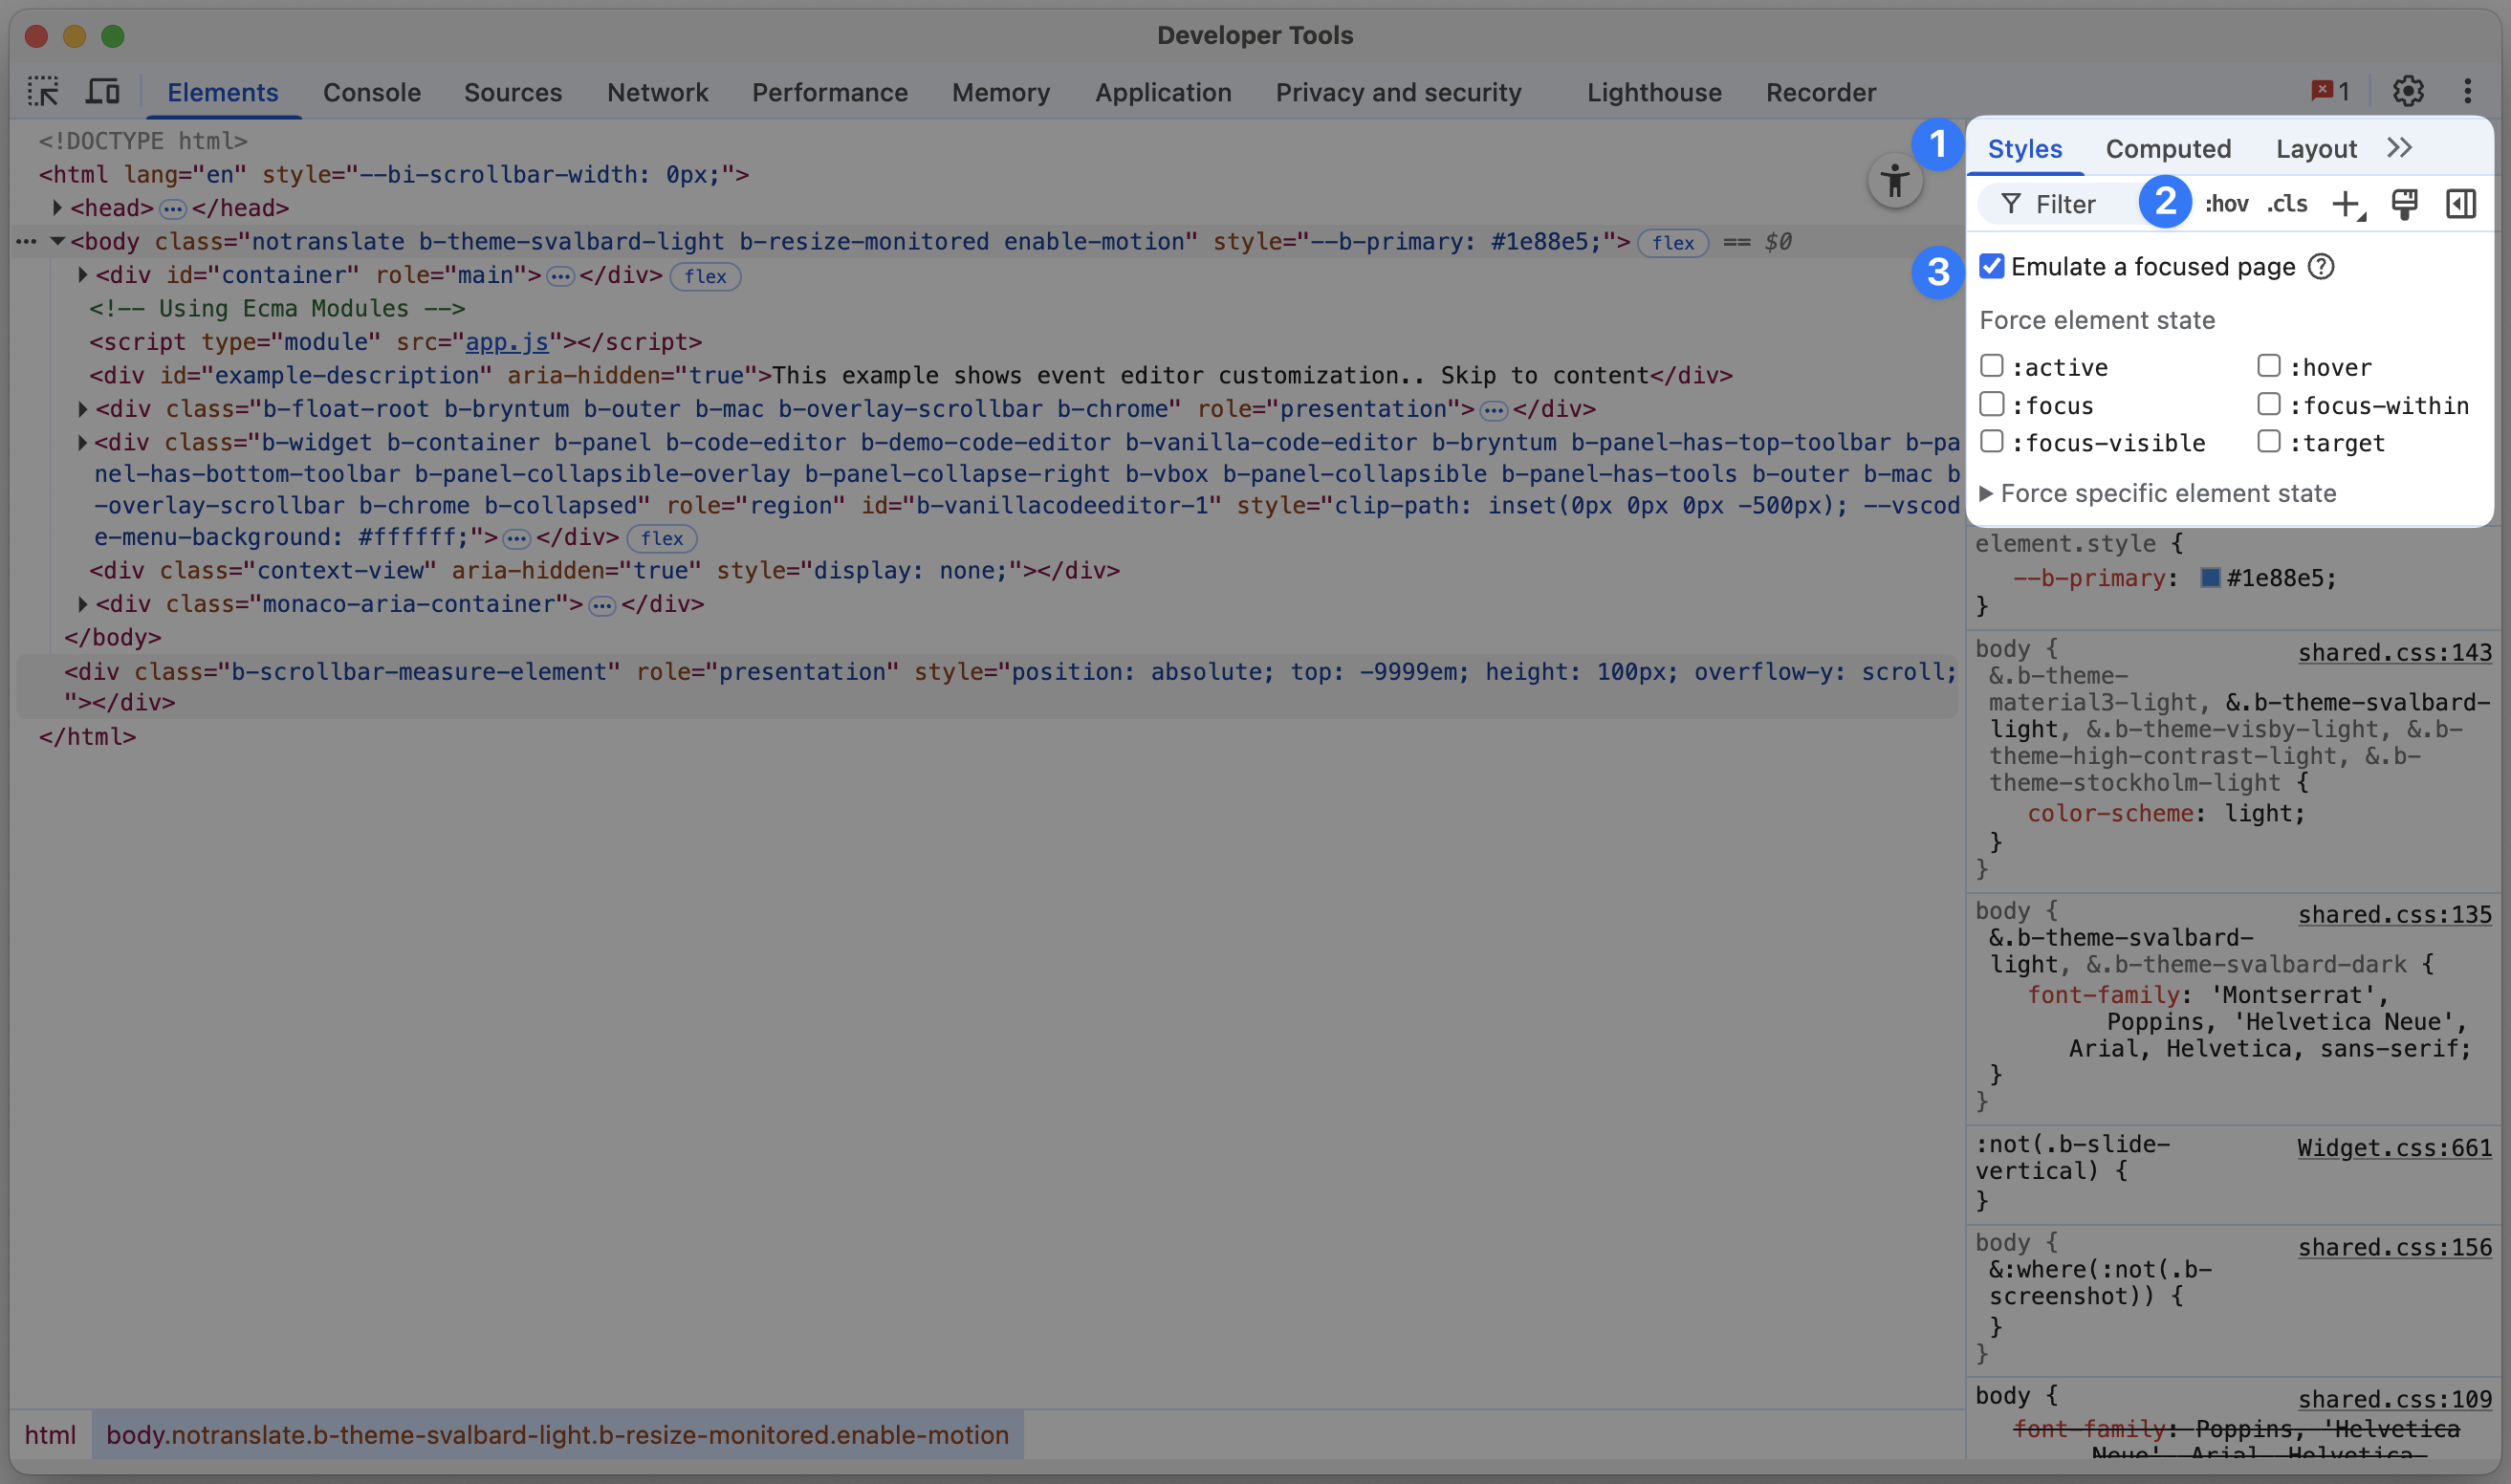
Note that as of August 2025, Chrome has a bug where this setting sometimes fails and the checkbox needs to be cleared and rechecked for it to take effect again.
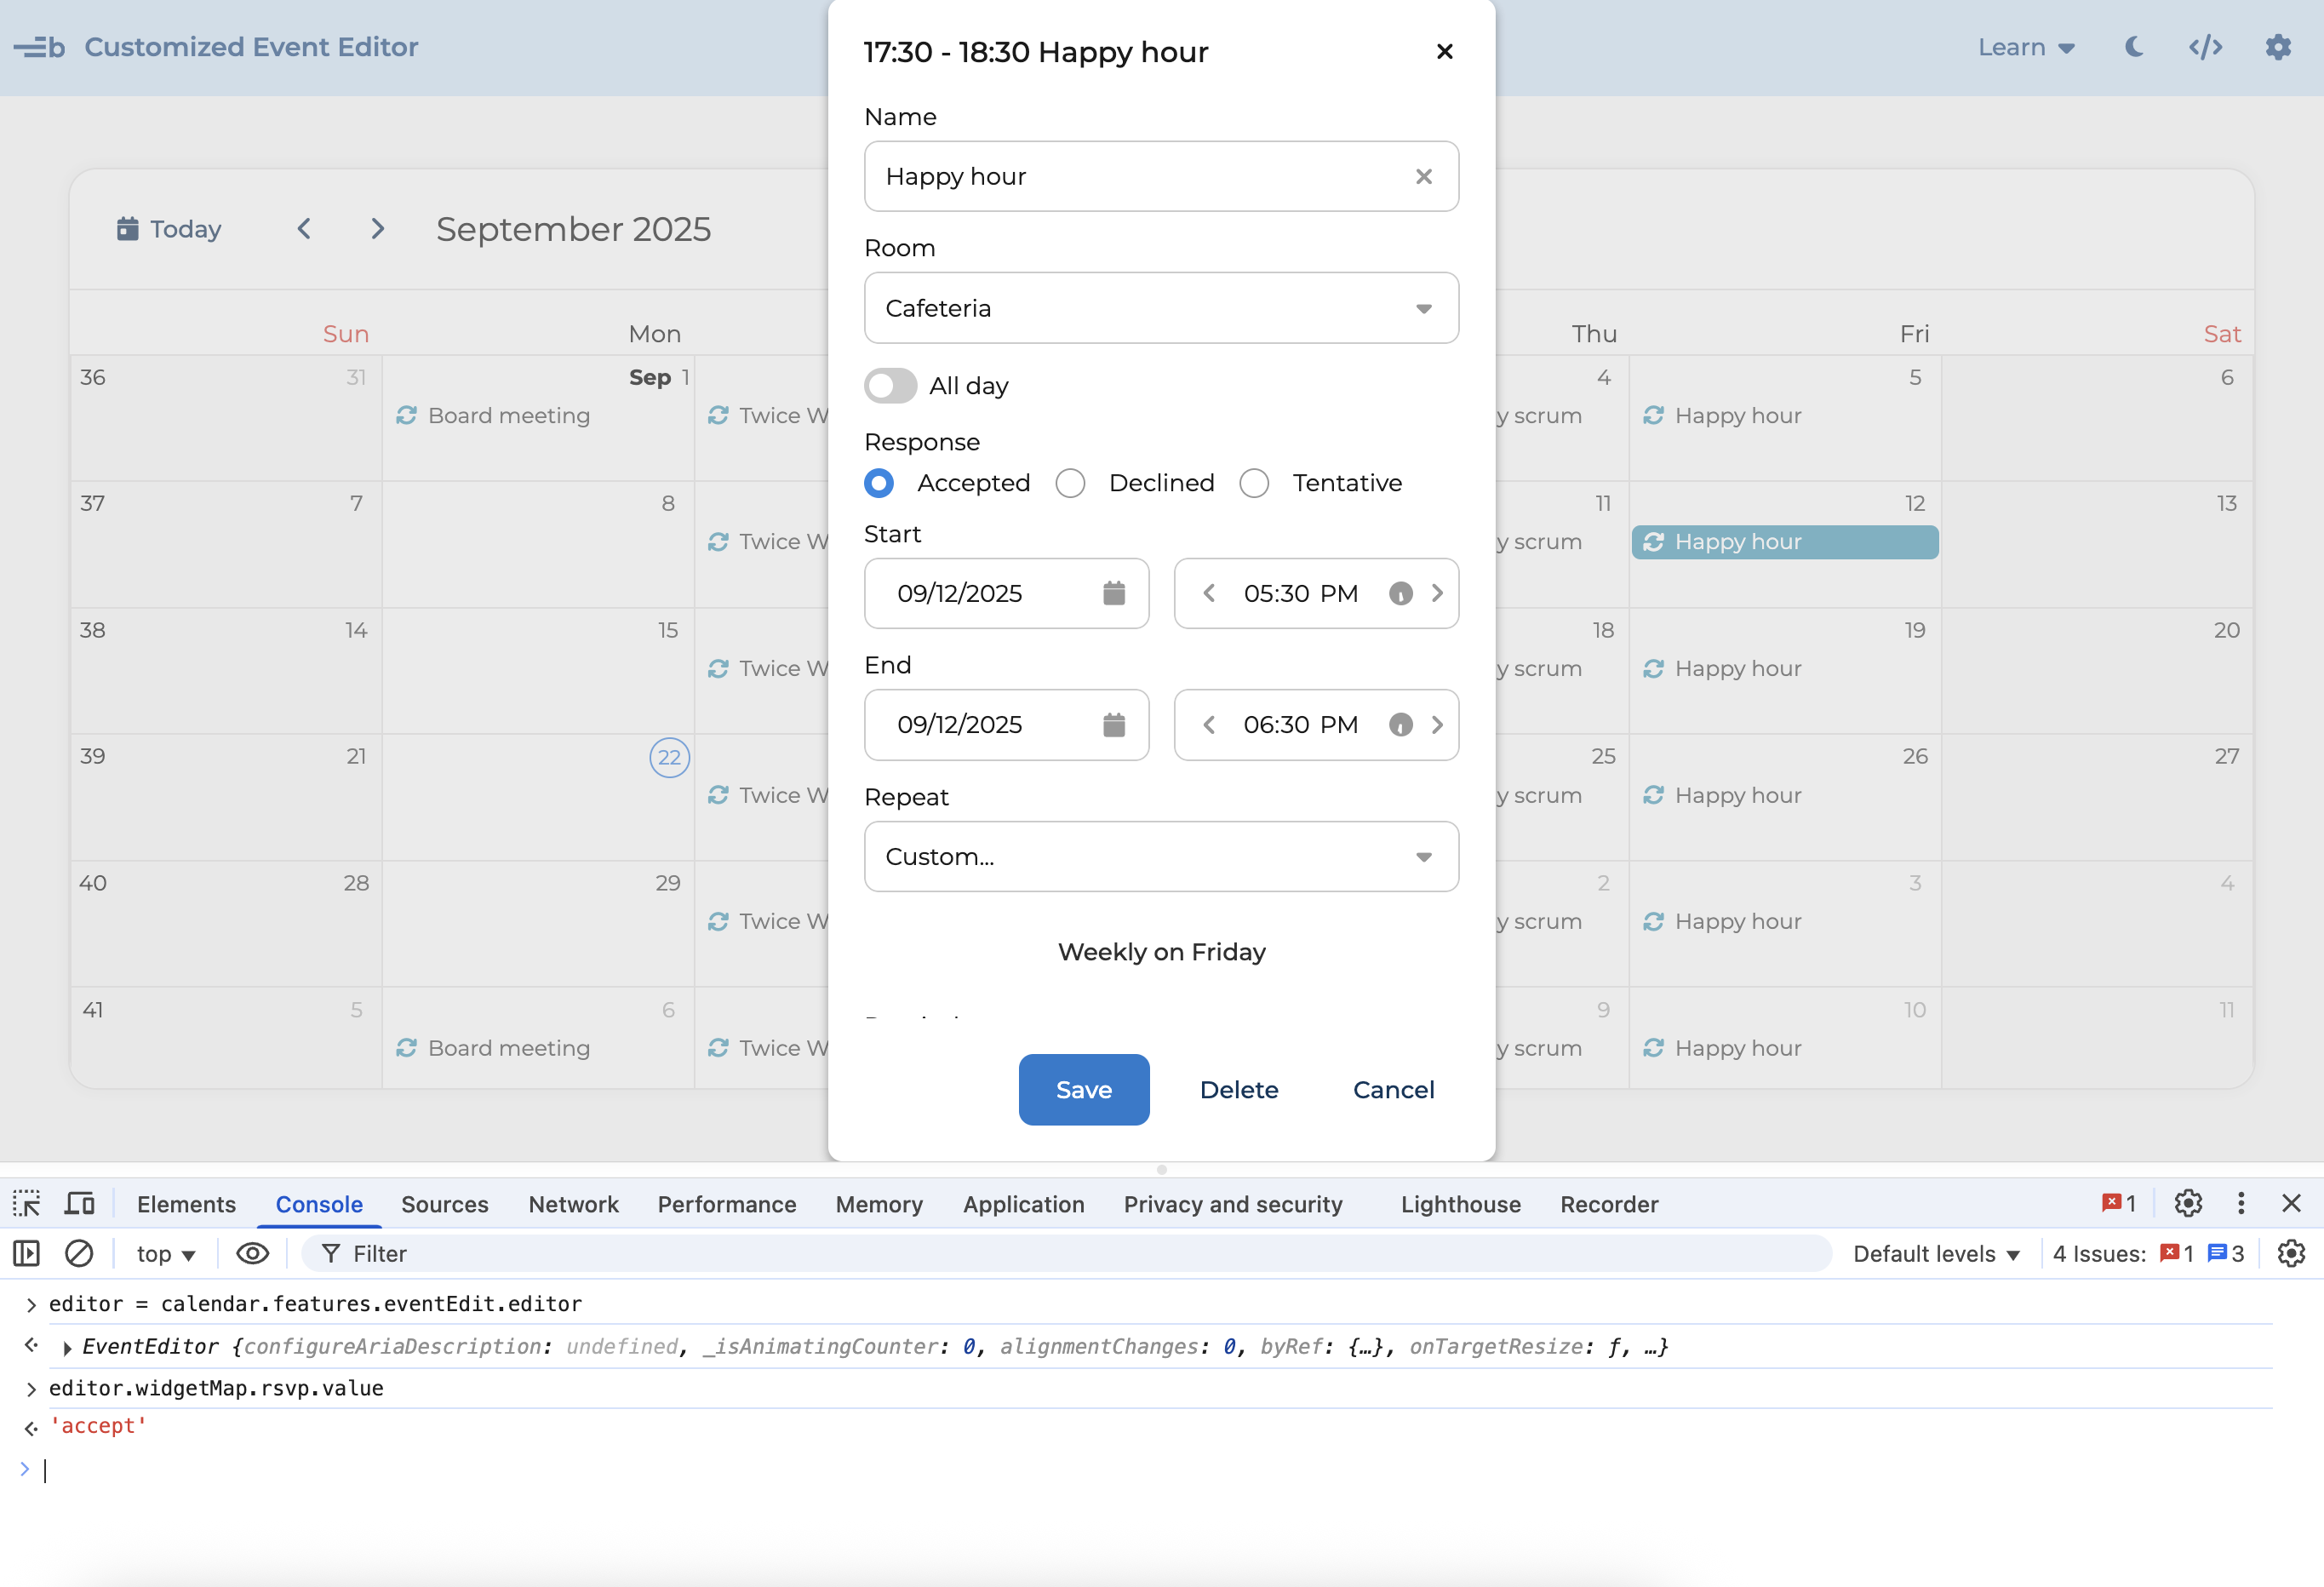
This is useful for debugging the EventEditor or TaskEditor which hides itself when focus leaves. With this option set, you can operate
the debugger and examine and change application state while the editor is displayed:
Reproducing faults using Bryntum's online examples
The Javascript examples allow you to examine and modify the code:
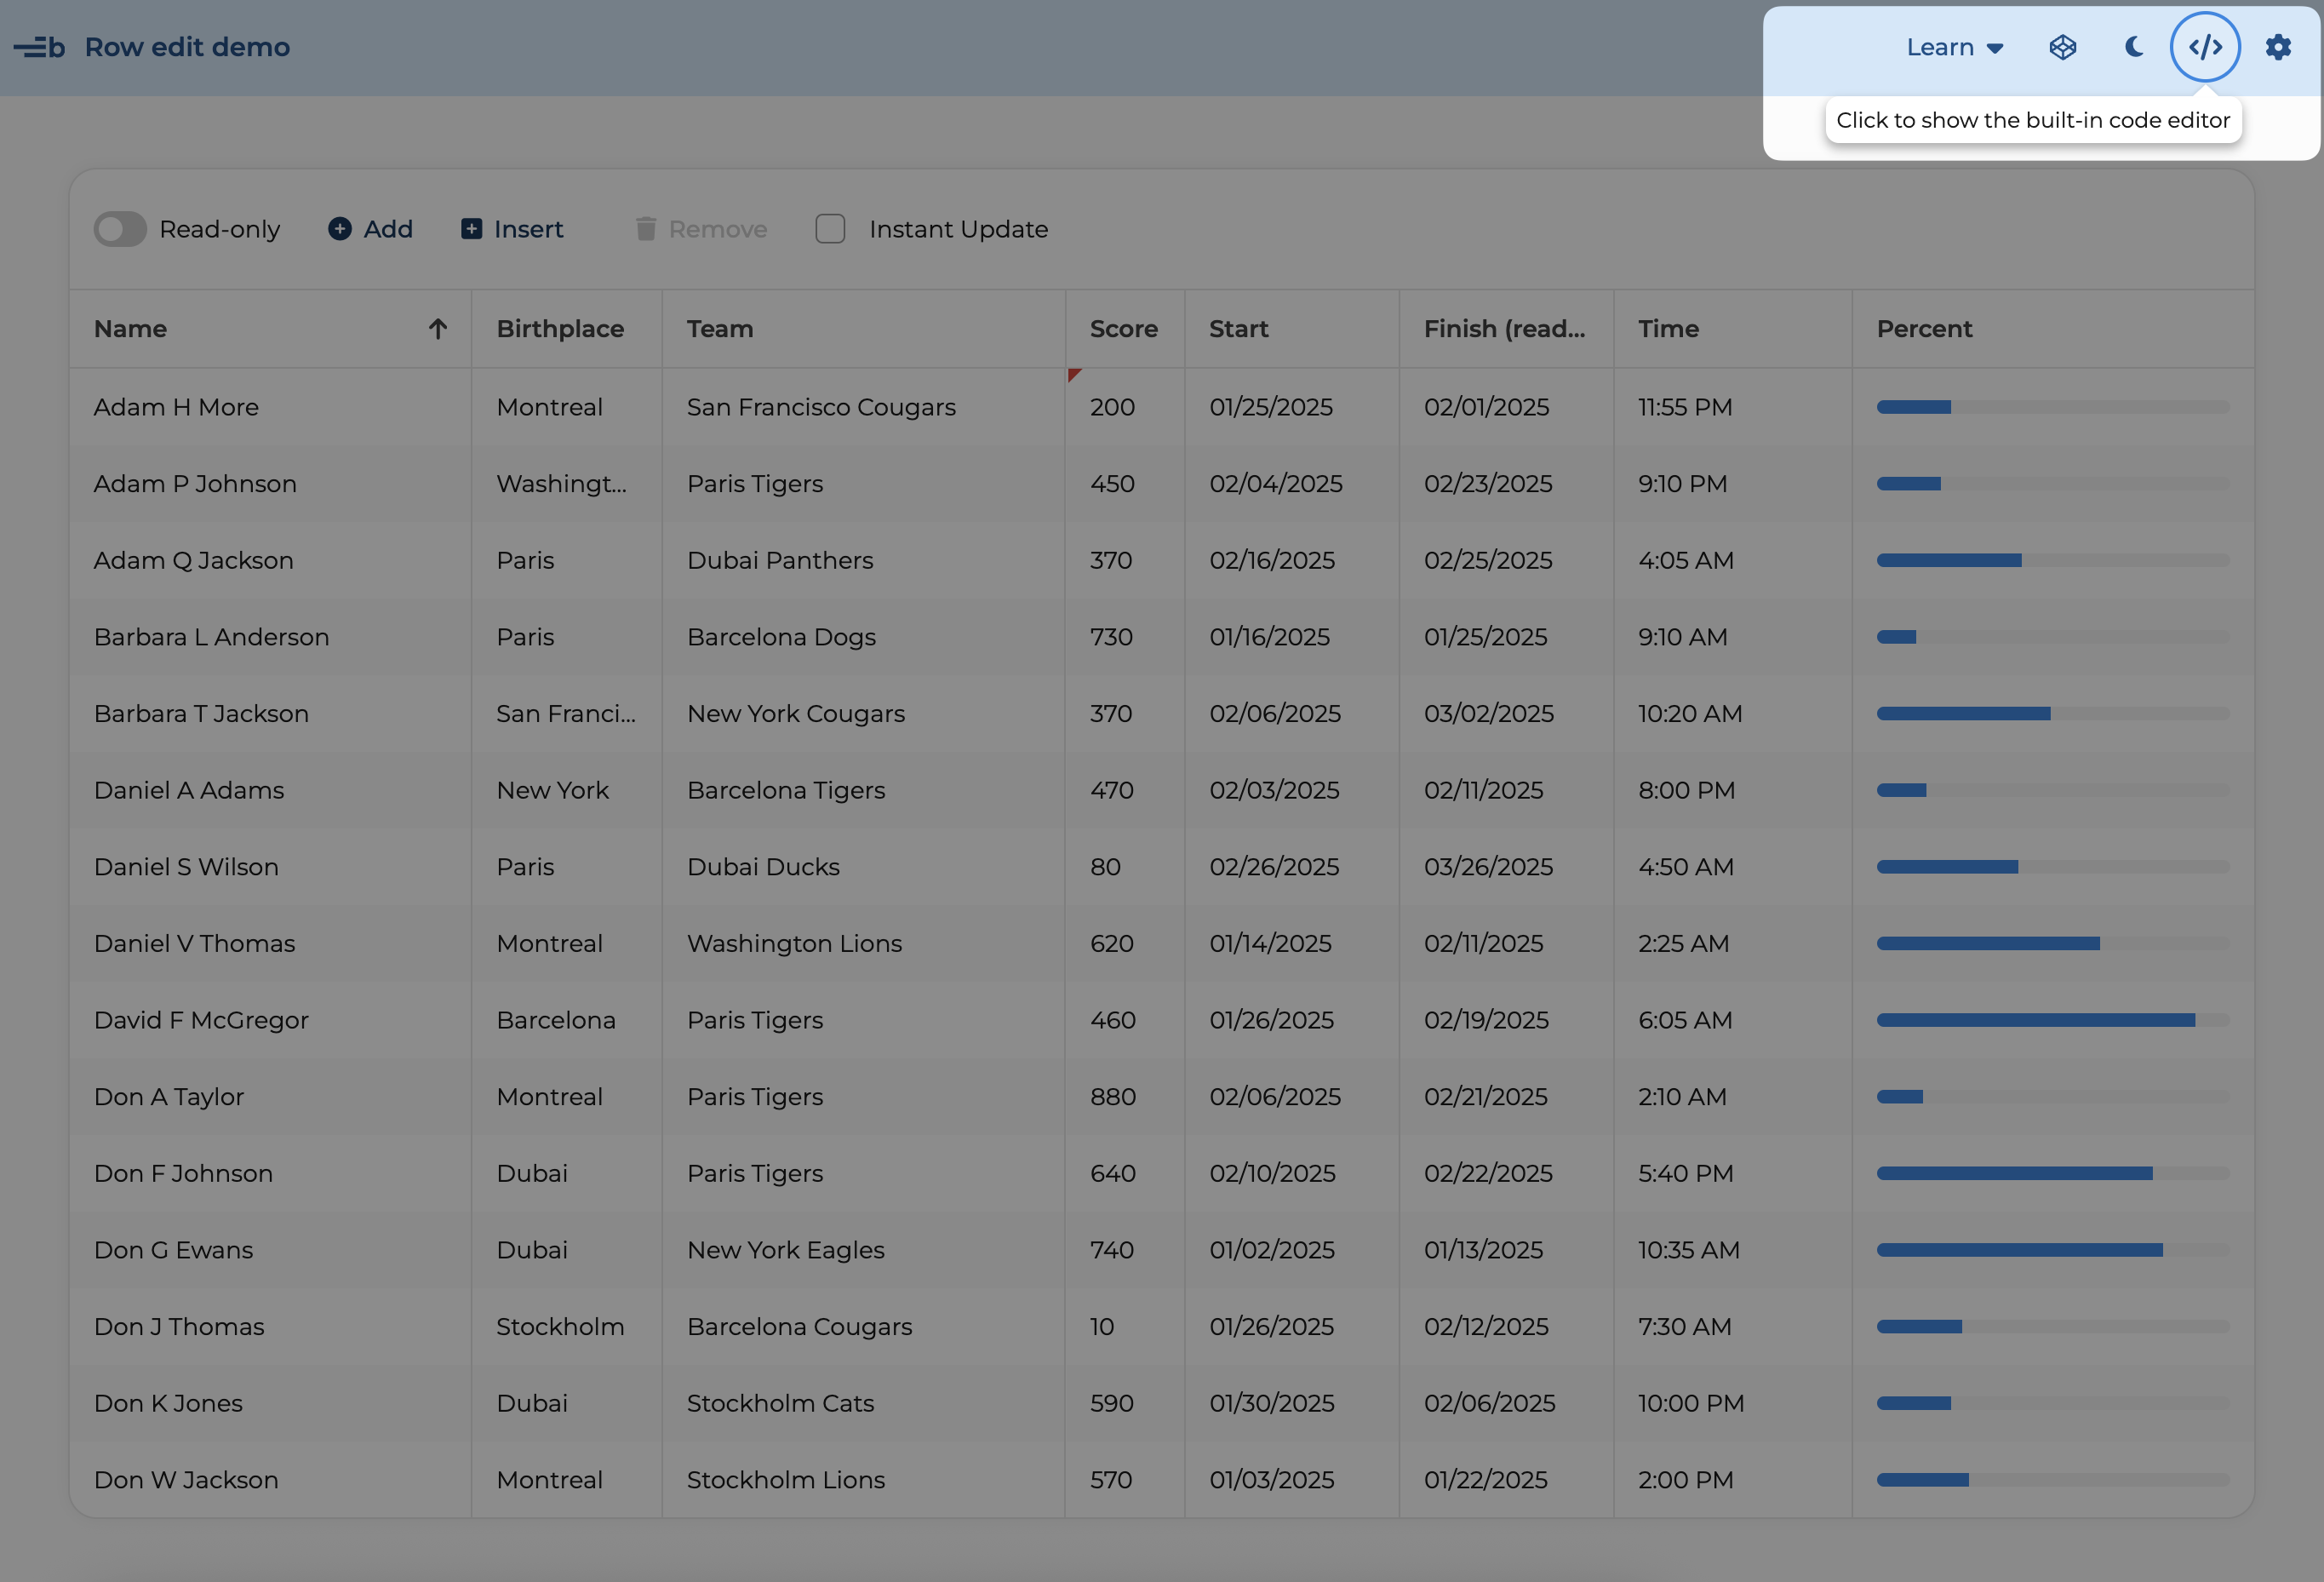
This allows you to experiment with the API. The editor is the Monaco editor used by Visual Studio Code:
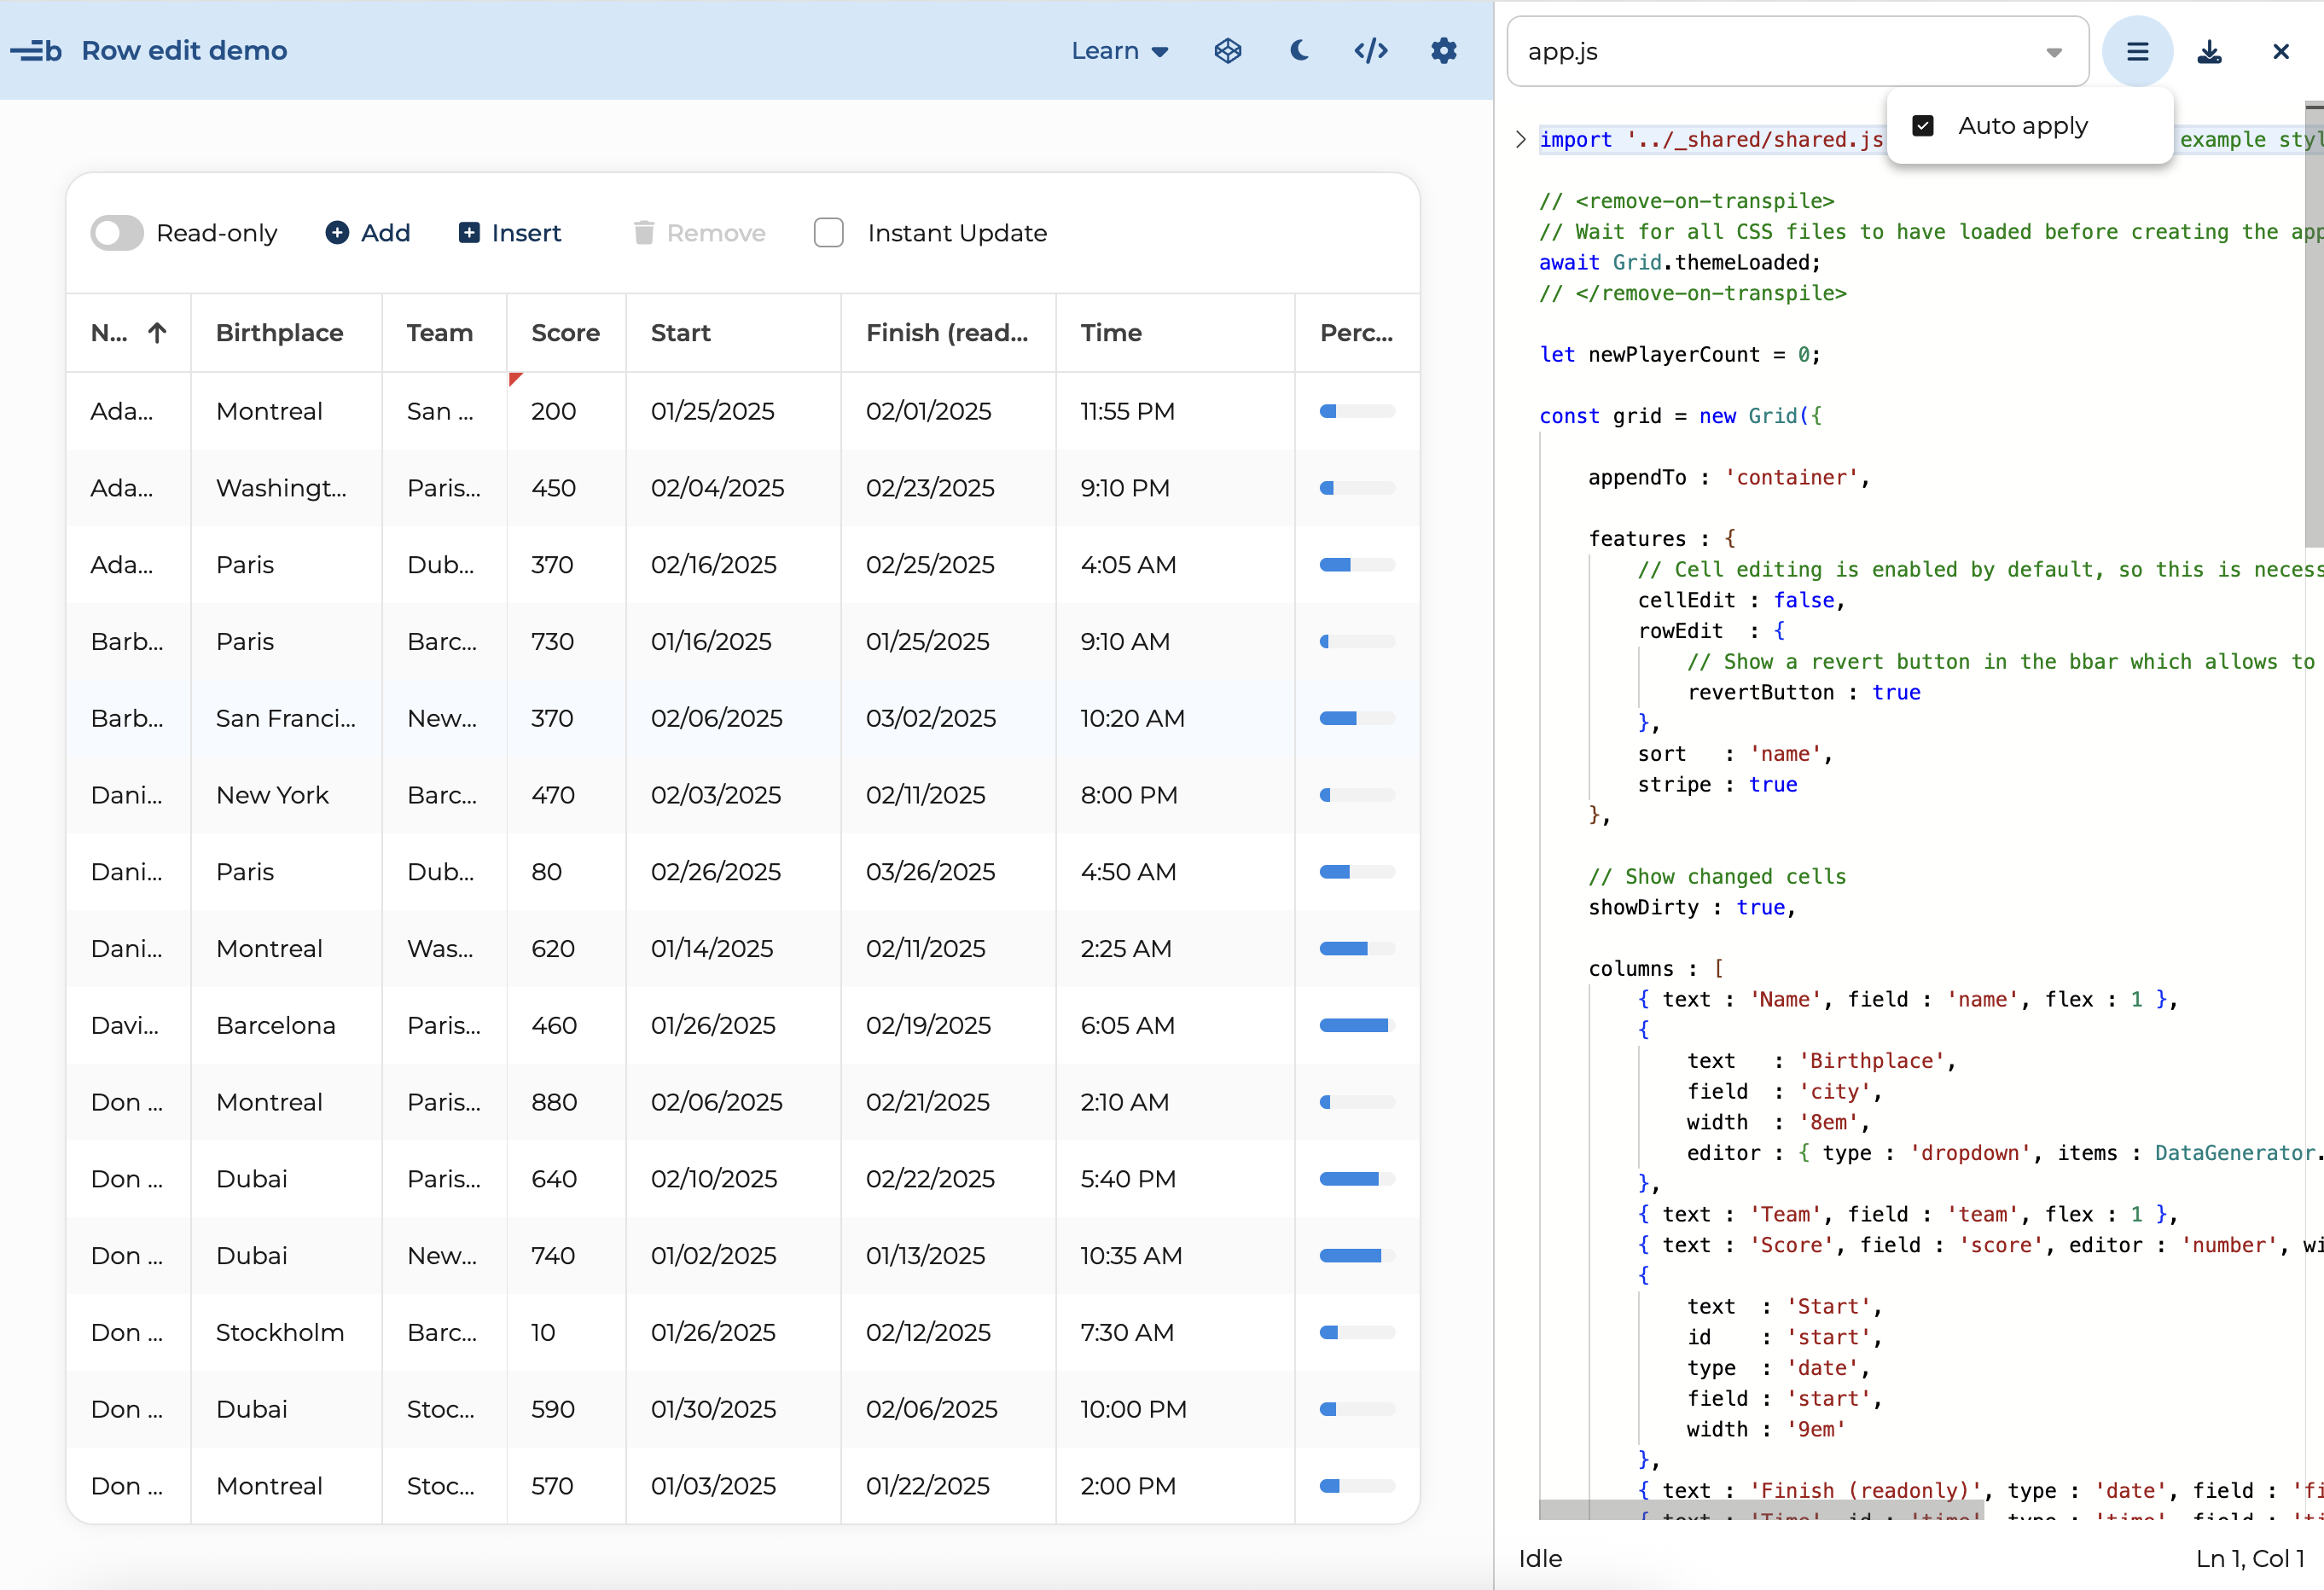
You can then use the "Open in Codepen" button in the application toolbar to create a Codepen based upon the state of the application.